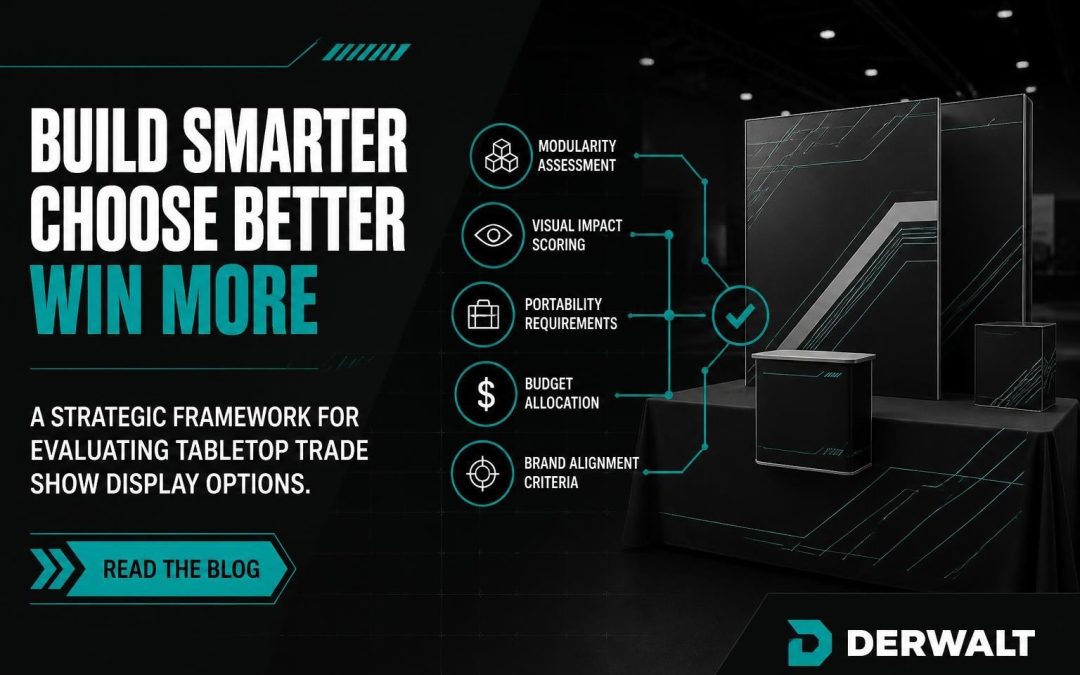
A tabletop trade show display represents one of the most cost-effective, versatile entry points into exhibition marketing. For brands seeking maximum impact within constrained budgets and limited floor space, these compact solutions deliver exceptional visibility when designed and deployed strategically. Understanding the selection criteria, design principles, and deployment methodologies transforms a simple table setup into a powerful brand engagement tool that competes effectively against larger booth installations.
Strategic Value of Compact Exhibition Solutions
The tabletop trade show display continues to prove its worth across industries, particularly as organizations refine their exhibition strategies around measurable outcomes rather than sheer footprint size. These displays typically occupy 6 to 8 feet of table space, yet deliver brand visibility that extends well beyond their physical dimensions when executed properly.
Budget efficiency drives much of the strategic appeal. Capital expenditure for a professional tabletop display ranges from $300 to $3,000, representing a fraction of the investment required for island or peninsula booth configurations. This cost structure enables marketing teams to participate in multiple events annually while maintaining consistent branding standards.
Deployment flexibility adds another strategic dimension. A single tabletop trade show display can serve multiple functions across different event types:
- Regional industry conferences with limited booth availability
- Product launch events requiring portable demonstration stations
- Recruitment fairs needing professional brand representation
- Client presentation environments demanding polished visual support
- Pop-up retail activations in temporary venues
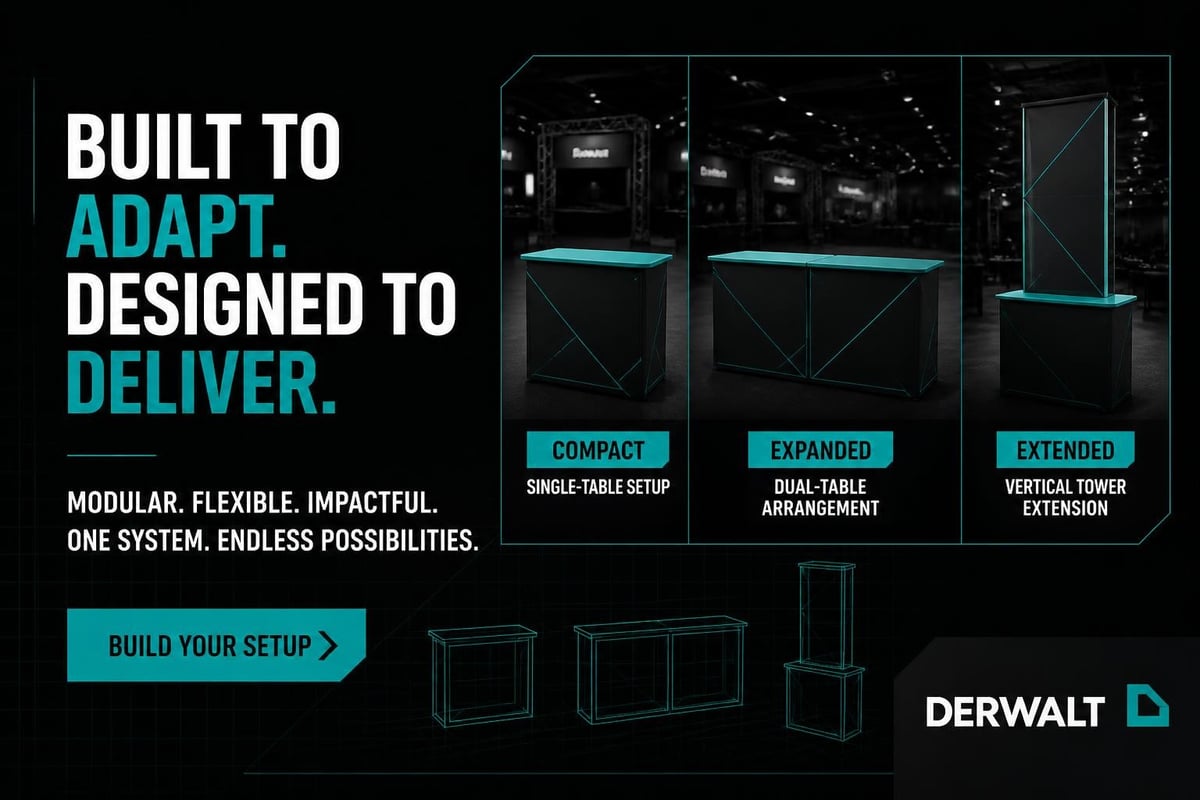
The modular nature of contemporary designs allows brands to scale their presence up or down based on specific event requirements. Components can be reconfigured, graphics updated seasonally, and structural elements repurposed across different marketing initiatives, maximizing return on production investment.
Selection Criteria for Production Intelligence
Choosing the optimal tabletop trade show display requires systematic evaluation against specific operational and strategic parameters. Production intelligence means selecting systems that align with your brand activation objectives while minimizing logistical complexity and operational risk.
Structural format represents the foundational decision point. The various types of tabletop trade show displays each offer distinct advantages depending on your deployment scenario. Pop-up displays provide maximum visual impact through curved or straight fabric graphics that create dimensional backdrops. Retractable banner systems offer unmatched portability and setup speed. Tension fabric displays deliver premium aesthetics with wrinkle-free graphics stretched across lightweight aluminum frames.
| Display Type | Setup Time | Visual Impact | Portability | Lifespan | Ideal Application |
|---|---|---|---|---|---|
| Pop-Up Frame | 15-20 min | High | Moderate | 5-7 years | Multi-day conferences |
| Retractable Banner | 2-5 min | Moderate | Excellent | 3-5 years | Frequent travel events |
| Tension Fabric | 10-15 min | Very High | Good | 5-8 years | Premium brand positioning |
| Folding Panel | 5-10 min | Moderate | Excellent | 4-6 years | Recruitment and registration |
| Backlit System | 20-25 min | Excellent | Poor | 6-10 years | Flagship product showcases |
Transport logistics must inform selection decisions. Calculate total shipping weight, packed dimensions, and case durability based on your typical event circuit. A display traveling internationally requires different specifications than one moving regionally by vehicle.
Graphics production capabilities matter significantly. Dye-sublimation fabric graphics offer superior color reproduction and wrinkle resistance compared to vinyl alternatives. However, they require specialized printing capabilities and may influence vendor selection and turnaround times.
Design Principles for Maximum Brand Impact
Effective tabletop trade show display design operates within strict spatial and visual constraints. Every square inch must work strategically to communicate brand identity, capture attention, and facilitate meaningful engagement within seconds of visual contact.
Visual hierarchy determines success in crowded exhibition halls where hundreds of stimuli compete simultaneously for attendee attention. Your display must communicate three information layers instantaneously: brand recognition (who you are), value proposition (what you solve), and engagement invitation (why they should stop).
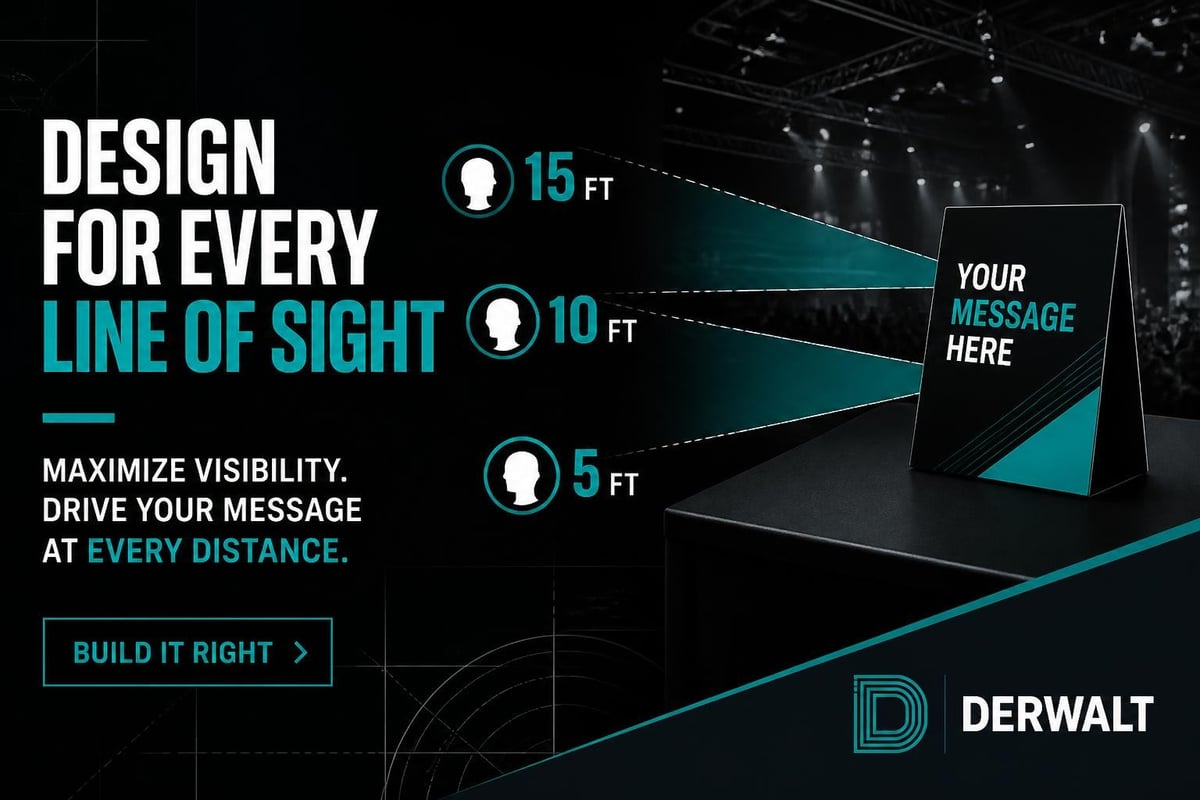
The strategies that work for tabletop displays emphasize clarity over complexity. Primary messaging should be readable from 10 to 15 feet away, utilizing fonts no smaller than 3 inches in height for headline elements. Secondary information can scale down to 1.5 to 2 inches, while tertiary details should appear on collateral materials rather than the display itself.
Color psychology influences engagement rates measurably. High-contrast combinations (dark backgrounds with light text or vice versa) increase readability under variable exhibition hall lighting. Brand colors should dominate, but strategic accent colors can guide eye movement and highlight calls to action.
Structural Layout Optimization
Dimensional planning separates amateur installations from professional brand experiences. Standard exhibition tables measure 6 or 8 feet in length, 30 inches in height, and 30 inches in depth. Your tabletop trade show display must optimize this fixed footprint while maintaining stability and professional appearance.
Vertical expansion maximizes visibility in dense show floor environments. Displays extending 4 to 6 feet above the table surface create sight lines visible across multiple booth rows. The pyramid-style design approach leverages natural eye movement patterns, drawing attention upward to featured messaging before guiding viewers down to product displays and interactive elements.
Consider the complete spatial envelope:
- Backdrop zone (rear 6-8 inches): Primary graphic display and brand identity
- Product display zone (middle 12-18 inches): Physical products, demonstrations, samples
- Engagement zone (front 6-8 inches): Literature, business card holders, interactive touchpoints
- Side access (flanking areas): Open approach paths preventing barrier perception
Lighting integration transforms basic displays into premium brand experiences. LED strip lighting integrated into frame systems costs $150 to $400 but increases perceived value dramatically. Backlit graphics command attention in dimly lit exhibition venues common at evening networking sessions or hotel ballroom events.
Material selection communicates quality standards before any verbal exchange occurs. Aluminum frame systems project durability and professionalism compared to plastic alternatives. Premium fabric textures, rigid graphic panels, and thoughtful finish details signal brand attention to quality that audiences unconsciously associate with product or service excellence.
Technical Specifications and Production Standards
Professional event production demands technical precision in every component specification. A tabletop trade show display represents physical brand expression, and production standards must reflect the quality expectations you maintain across all customer touchpoints.
Frame engineering determines structural reliability across multiple deployment cycles. Look for systems utilizing 1-inch to 1.5-inch diameter aluminum tubing with reinforced corner connections. Snap-button assembly mechanisms provide tool-free setup while maintaining connection integrity through dozens of installations. Magnetic frame connectors offer even faster assembly but may lack the structural rigidity required for taller configurations.
Graphics production specifications directly impact visual quality and longevity:
- Fabric graphics: 9-ounce dye-sublimation polyester minimum, with sewn silicone edge beading for tension frame systems
- Vinyl graphics: 13-ounce blockout material for retractable systems, with scratch-resistant lamination
- Rigid panels: 3mm PVC or foam board for folding displays, UV-printed with matte or gloss finish options
Weight calculations affect shipping costs and setup logistics. Target total packed weight under 50 pounds for single-person transport capability. Exceed 75 pounds and you require two-person teams for safe handling, increasing labor costs at each event.
Integration with Broader Exhibition Strategy
The tabletop trade show display functions as one component within comprehensive trade show productions that include pre-event promotion, on-site engagement protocols, and post-event follow-up systems. Strategic integration maximizes marketing investment returns.
Digital integration amplifies physical presence. QR codes linking to campaign-specific landing pages track engagement attribution. NFC-enabled business cards streamline contact exchange. Tablet-based product demonstrations complement physical displays while capturing qualification data in CRM systems.
Staffing protocols determine conversion effectiveness. A professionally designed display creates the initial attraction, but trained brand ambassadors convert interest into qualified leads. Define clear engagement scripts, qualification criteria, and handoff procedures before the show floor opens.
Literature architecture supports the display strategy. Rather than cluttering table space with multiple brochures, deploy a single premium leave-behind piece supported by digital resources accessed via QR codes. This approach reduces shipping weight, minimizes waste, and provides better engagement tracking.
Deployment Logistics and Operational Excellence
Operational excellence in tabletop trade show display deployment requires systematic planning across transport, setup, and breakdown phases. Production intelligence means anticipating complications before they occur and building redundancy into every process.
Shipping strategy varies based on event location, timeline, and budget parameters. Advance warehouse shipping (3 to 4 weeks prior) offers lowest cost but requires precise coordination with show management. Direct-to-show shipping (1 to 2 weeks prior) increases costs but reduces scheduling risk. Hand-carry options work for compact displays when air travel is already budgeted.
- Calculate dimensional weight for shipping quotes (length × width × height ÷ 166 for domestic shipping)
- Build protective cases meeting ISTA 3A testing standards for freight shipment durability
- Label all cases with show name, booth number, company name, and handling instructions
- Maintain photographic documentation of packed configurations for reverse setup at show conclusion
Setup efficiency reduces labor costs and stress. Practice complete installation sequences before departing for events. Time your setup and identify bottlenecks or confusing steps. Create laminated setup instruction cards stored inside shipping cases for reference by any team member.
The exhibition panel design principles that govern larger booth installations apply equally to compact formats, emphasizing clean execution, attention to finishing details, and systematic quality checks before show floor opening.
Maintenance Protocols for Long-Term Performance
Protecting your investment requires systematic maintenance between deployments. Fabric graphics should be rolled rather than folded to prevent permanent creases. Frame components need inspection for bent tubing, damaged connectors, or worn hardware before each use. Lighting systems require battery or power supply testing.
Storage environment matters significantly. Climate-controlled spaces prevent moisture damage to graphics and corrosion on metal components. Proper case storage (never stacked more than three high) prevents structural damage. Maintain detailed inventory lists inside each case documenting all components for quick verification during setup.
When considering sustainability and 2025 trade show display trends, plan for graphics refresh cycles every 18 to 24 months while maintaining structural frames for 5 to 7 years. This approach balances contemporary aesthetics with production cost efficiency.
Five-step tabletop display deployment process: advance shipping coordination, venue receiving verification, staged component setup, quality inspection checklist, and post-event breakdown with condition documentation
ROI Measurement and Performance Optimization
Quantifying tabletop trade show display performance requires establishing clear metrics before event participation. Production intelligence extends beyond physical design into measurable business outcomes that justify marketing expenditure.
Lead acquisition costs provide the primary performance indicator. Calculate total event investment (display production, shipping, registration, travel, labor) divided by qualified leads generated. Compare this cost-per-lead against other marketing channels to validate exhibition strategy continuation or refinement.
Event-specific tracking mechanisms enable accurate attribution:
- Unique promotional codes for show-exclusive offers
- Dedicated landing pages accessible only via display QR codes
- Badge scanning systems with immediate CRM integration
- Post-event surveys asking about specific display elements that attracted attention
Brand awareness metrics supplement direct response data. Social media mentions, booth photography shares, and post-event web traffic spikes indicate broader brand impact beyond immediate lead generation.
Why smaller tabletop displays can outperform bigger booths often relates to engagement quality over quantity. Compact footprints create intimate conversation environments rather than overwhelming visitors with excessive visual stimuli and aggressive sales approaches.
Competitive Positioning Analysis
Analyze competitive booth strategies at target events before finalizing your tabletop trade show display design. Photograph competitor setups, noting messaging approaches, color schemes, engagement tactics, and traffic patterns. Identify differentiation opportunities where your display can communicate unique value propositions clearly.
Industry events attract specific audience demographics with particular expectations. Technology conferences reward innovation and interactivity. Healthcare events demand clinical credibility and regulatory compliance communication. Financial services audiences expect sophistication and stability messaging. Align display design with industry-specific communication norms while maintaining brand distinctiveness.
The relationship between display investment and event tier matters strategically. Premier industry conferences justify higher-end displays given qualified audience concentration. Regional events may warrant more economical solutions with budget allocated toward increased event participation frequency.
Contemporary Design Trends Shaping 2026 Deployments
Understanding emerging design directions ensures your tabletop trade show display remains contemporary and competitive. The trade show booth design trends for 2026 emphasize experience-driven engagement, technological integration, and sustainability consciousness, principles applicable across all booth sizes.
Minimalist aesthetics dominate current design thinking, reflecting broader brand communication trends toward clarity and simplicity. Clean backgrounds with bold typography, generous white space, and singular focal points outperform cluttered designs attempting to communicate multiple messages simultaneously.
Sustainability messaging influences purchasing decisions across B2B sectors. Displays utilizing recyclable aluminum frames, PET fabric graphics from recycled bottles, and LED lighting systems communicate environmental responsibility. Documenting the sustainability profile of your display components provides talking points during booth conversations and strengthens brand positioning.
Interactive technology integration continues expanding, though budget constraints limit adoption in tabletop formats. Consider these cost-effective options:
- Tablet-based product configurators ($200-$500 per unit)
- Digital business card exchange apps (free to $15/month)
- Social media photo opportunities with branded hashtags (design cost only)
- QR-code activated video demonstrations (production cost variable)
When working with comprehensive production management services, strategic display design integrates with broader brand activation objectives, ensuring consistency across all customer touchpoints while maintaining operational efficiency.
Supplier Selection and Production Partnership
Choosing the right production partner for your tabletop trade show display impacts quality, timeline reliability, and long-term support availability. Production intelligence means evaluating suppliers against operational criteria rather than price alone.
Manufacturing capabilities determine quality consistency. Domestic production offers faster turnaround and easier quality control but typically costs 20% to 40% more than overseas manufacturing. Overseas production reduces unit costs but extends lead times to 8 to 12 weeks and complicates revision processes.
Evaluate potential suppliers across these dimensions:
| Evaluation Criteria | Weight | Assessment Method |
|---|---|---|
| Sample quality | 25% | Request physical samples before committing |
| Production timeline | 20% | Verify lead times against event schedule |
| Graphics capabilities | 20% | Review print samples for color accuracy |
| Customer service | 15% | Test responsiveness during quote phase |
| Warranty coverage | 10% | Compare structural and graphics warranties |
| Customization flexibility | 10% | Discuss modification options |
Request detailed specifications before production begins. Graphics files should be reviewed at actual size, color-corrected, and approved in writing. Structural dimensions must be verified against venue table specifications. Lighting systems require power consumption documentation for venue electrical planning.
Building relationships with reliable suppliers enables faster turnaround for rush projects, priority scheduling during peak seasons, and negotiated pricing for multi-display orders. For organizations deploying teams across multiple simultaneous events, supplier capacity to produce consistent quality across multiple units becomes critical.
Pre-Event Preparation and On-Site Execution
Strategic preparation transforms tabletop trade show display potential into actual performance. The weeks preceding an event determine success as significantly as the display design itself.
Advance planning timelines should follow this sequence:
- 12 weeks out: Finalize display design and approve graphics production
- 10 weeks out: Confirm shipping deadlines and receive timeline from show management
- 8 weeks out: Complete graphics production and conduct quality inspection
- 6 weeks out: Ship to advance warehouse or schedule direct-to-show shipping
- 4 weeks out: Confirm booth staff assignments and schedule training
- 2 weeks out: Verify display arrival at show warehouse and resolve any shipping issues
- 1 week out: Conduct final team briefing covering setup procedures, engagement protocols, lead qualification criteria
On-site execution requires systematic attention to detail. Arrive at your booth assignment with setup instructions, component inventory list, and necessary tools. Many venues restrict power tool use, so design displays requiring only hand-assembly. Verify table stability before mounting displays, requesting venue services to address any wobble or damage.
Professional event experiences demonstrate attention to finishing details that amateur installations overlook. Cable management, lighting alignment, literature positioning, and floor cleanliness all contribute to overall brand perception.
Post-Event Analysis and Continuous Improvement
Every event deployment generates performance data that should inform future optimization. Systematic post-event analysis transforms experience into institutional knowledge that improves ROI across subsequent activations.
Immediate post-show debriefing should occur within 48 hours while details remain fresh. Gather booth staff to discuss what worked, what failed, and what surprised them. Document specific observations about display performance, traffic patterns, competitor strategies, and audience reactions.
Quantitative analysis provides objective performance measurement:
- Total booth visitors (estimated or badge-scan counted)
- Qualified leads generated meeting pre-defined criteria
- Literature distributed as engagement proxy metric
- Social media engagement (mentions, shares, photos)
- Direct costs per lead generated
Compare these metrics against previous events and industry benchmarks. Identify trends suggesting strategic shifts or tactical refinements. A declining cost-per-lead trend validates current strategy, while increasing costs signal need for evaluation.
Physical display condition assessment prevents degradation from compromising future performance. Inspect frame components for damage, graphics for tears or fading, lighting for functionality, and cases for structural integrity. Schedule repairs or replacements immediately rather than discovering problems during pre-event setup.
Strategic tabletop trade show display deployment requires balancing design excellence, operational efficiency, and measurable business outcomes. By applying production intelligence principles to selection, design, deployment, and optimization processes, organizations maximize exhibition marketing returns while minimizing operational complexity and risk exposure. DERWALT applies this same systematic approach across all event production and brand activation initiatives, delivering comprehensive production management that transforms creative concepts into flawlessly executed brand experiences throughout South Africa.
Recent Comments